
Registered User
Joined: 10/7/2004
Posts: 2,181
|
First of all, I am not so presumptuous as to think the setup that I use is anything any more special than anything else that is shared here. In fact, I often feel so intimidated when Diceman and others discuss international finance, etc. I just shut up and listen during those conversations; and try to learn.
But, since there has been some discussion about "the tobydad profile" (once again, I must emphasize that I did not name the way that I use these indicators, nor did I ever feel it deserved its own name), I figured I might ought to cover it one more time so that, as long as it's going to be discussed, it can be understood correctly.
This setup was designed to pick up a stock's earliest signs of momentum and upward movement. It has, many times, gotten me in to a stock's movement well before others see the potential. But it must be followed carefully and faithfully to gain its benefit. And it must be trusted! There will be the NBHW Zone (nail-biting, hand-wringing).
Also money management and discipline is essential. Finally, the LR30 must be watched carefully and strict attention paid to volume with respect to accumulation and distribution.
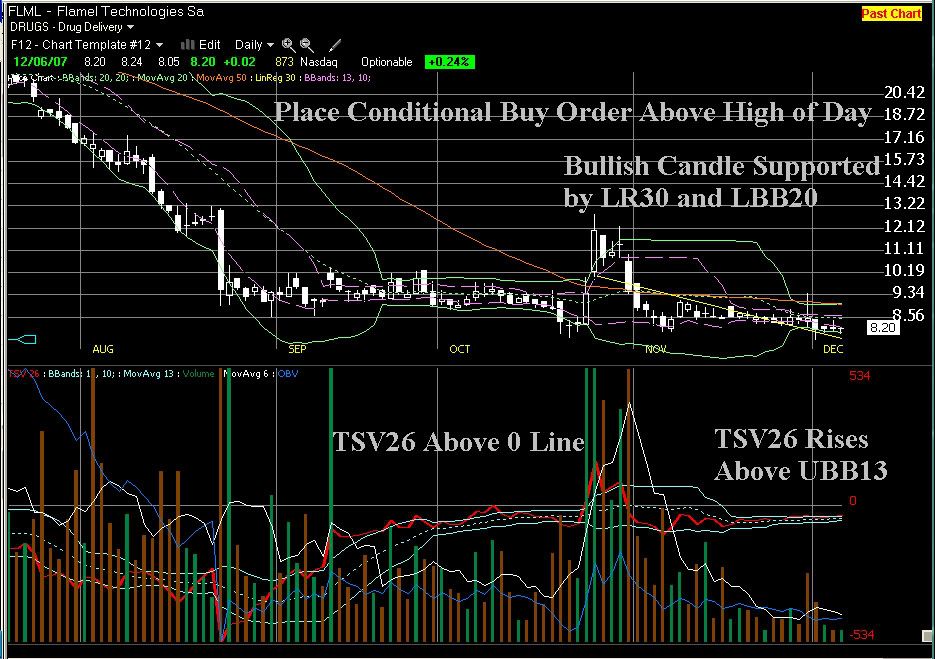
OK, looking at an example of how I would have used this on FLML (had I spotted the stock at the right time. Looking through the pics that follow and their commentary may help. After that, if anyone has interest, I will be happy to answer questions (I can't get over feeling silly saying that but I don't know what else to say).
I hope this is so
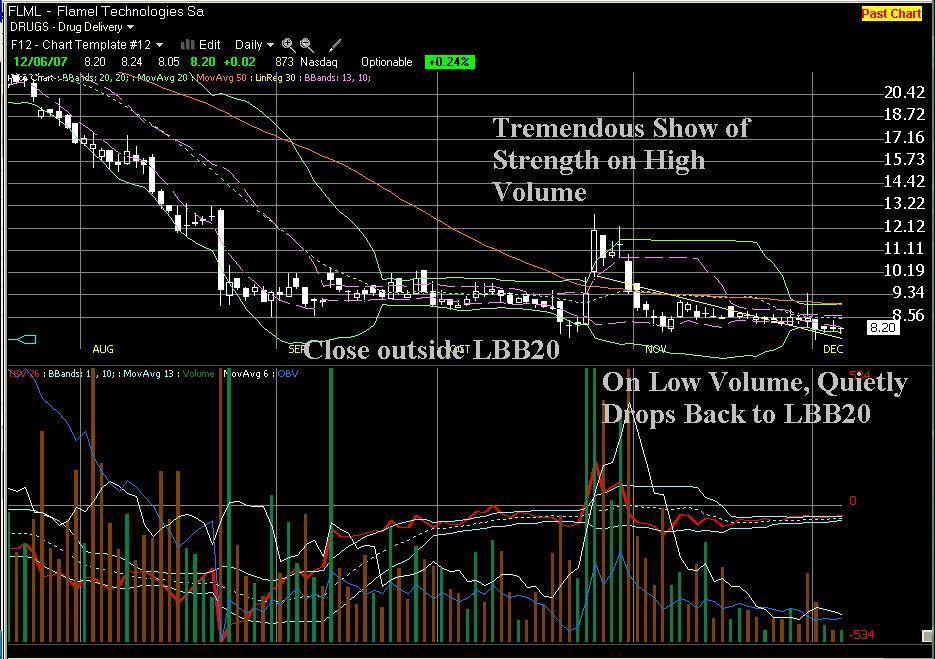
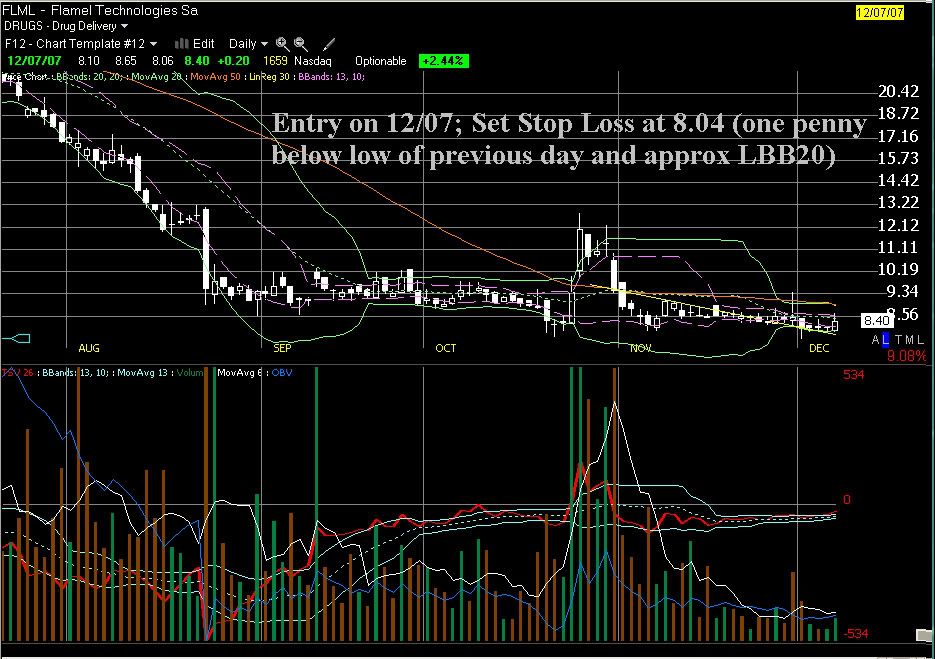
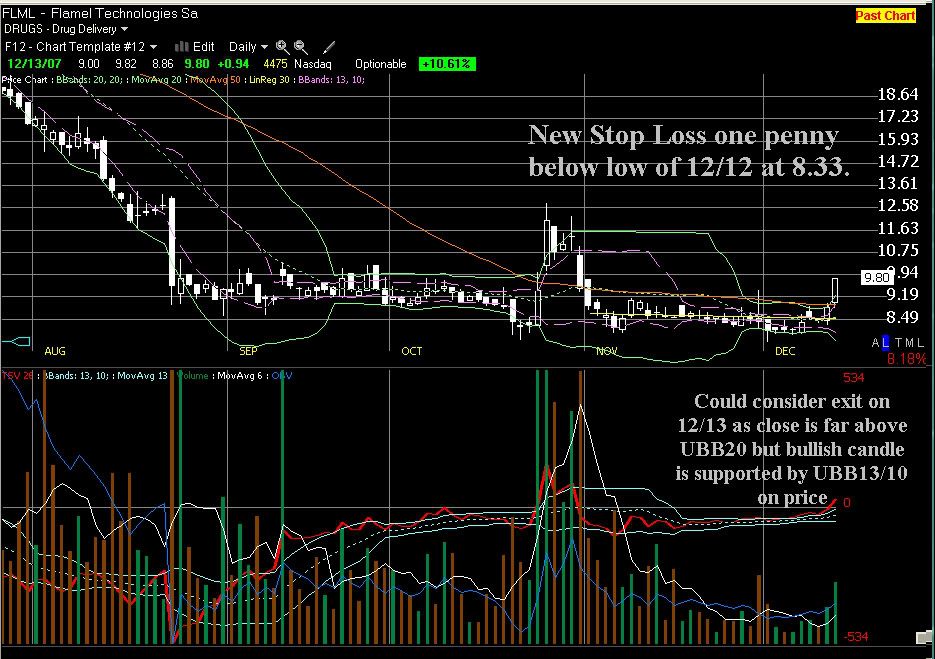
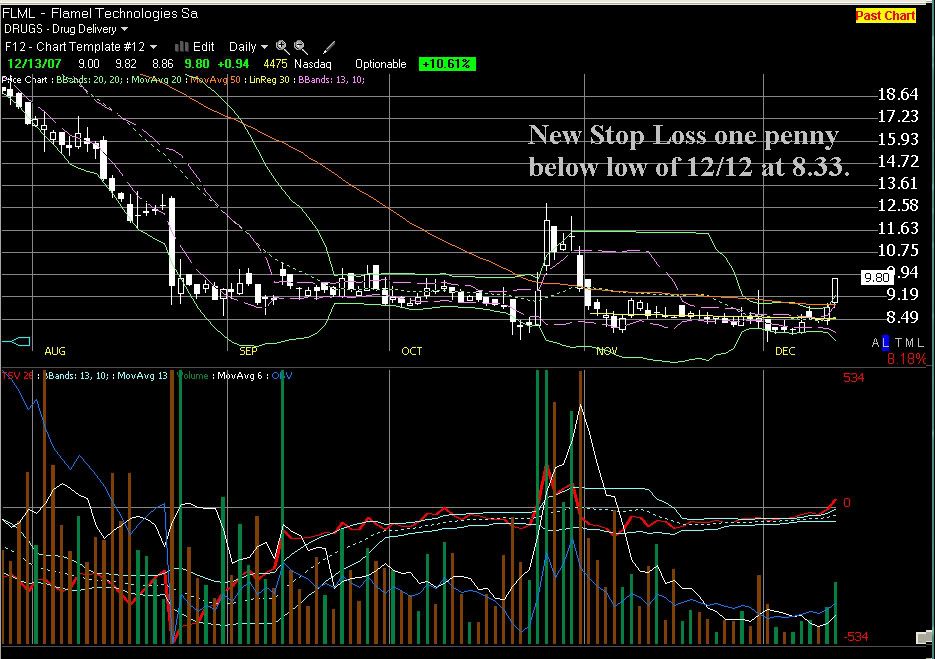
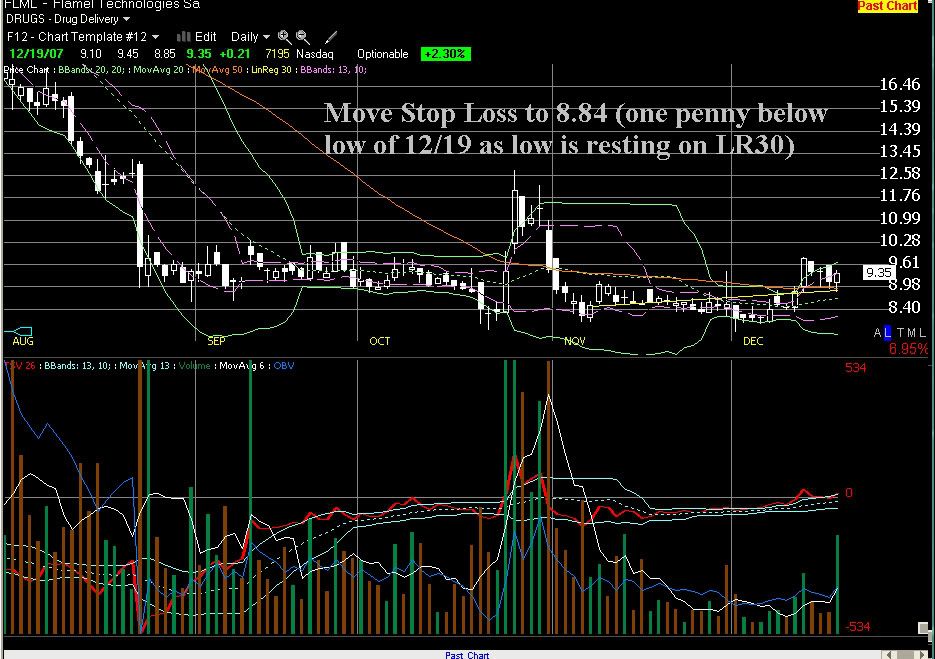
The stop losses are basically set based upon a 1-2-3 pattern in the lows and/or anytime a low pierces the LR30. Always set a conditional sell order one penny below the low of the day in question.
Good luck.
|
|
Registered User
Joined: 10/7/2004
Posts: 2,181
|
I think I was distracted/in a hurry when I typed that previous post. The comments in the pics appear to be correct but some of my comments were not as well phrased as I would have liked.
Again, much more to discuss (the reason behind the "why" of the setup, etc) but first we'll see if there's any interest.
|
|
Registered User
Joined: 10/7/2004
Posts: 2,181
|
Just a follow up thought I had.
|
|

Registered User
Joined: 8/8/2007
Posts: 42
|
I'm very interested in learning more. I like to bottom fish myself, mainly among tech stocks. Since I'm new to Telechart, I'd like to pick a strategy and understand what to look for in the charts.
Do you have a scan set up to look for stocks that exhibit the bottoming characteristics you're looking for? I set up the chart template, but none of stocks in my portfolio or watch list shared the characteristics of the chart of FLML.
Thanks for the info.
Mike
|
|
Registered User
Joined: 10/7/2004
Posts: 2,181
|
Here's a PCF I use:
C250 < AVGC200.250 AND C150 < AVGC200.150 AND C50 < AVGC200.50 AND C5 > AVGC200.5 AND C4 > AVGC200.4 AND C3 > AVGC200.3 AND C2 > AVGC200.2 AND C1 > AVGC200.1 AND C > AVGC200
But keep in mind, we joke about bottom fishing. Being able to detect a true bottom is impossible...no, not almost impossible....it's impossible. But what can be done is to catch the early moves out of a downtrend.
So when looking for those explosive early moves, the PCF above gives a little hint as to that break out. You'll still have to draw trendlines, watch volume and so forth.
You should probably get Diceman and apsll to weigh in on this. Apsll has developed some nice scans and indicator setups which have served him and all of us that have learned from his knowledge quite well. Don't restrict yourself to just one approach. I like to bottom fish, as it were, but that's just one part of my trading and the one I talk about most on this forum (mostly because everything else I do is pretty much just a repeat of standard techniques; I discuss the one that I've talked about in this thread because it's a little bit different).
Hope this helps.
|
|
Registered User
Joined: 10/7/2004
Posts: 2,181
|
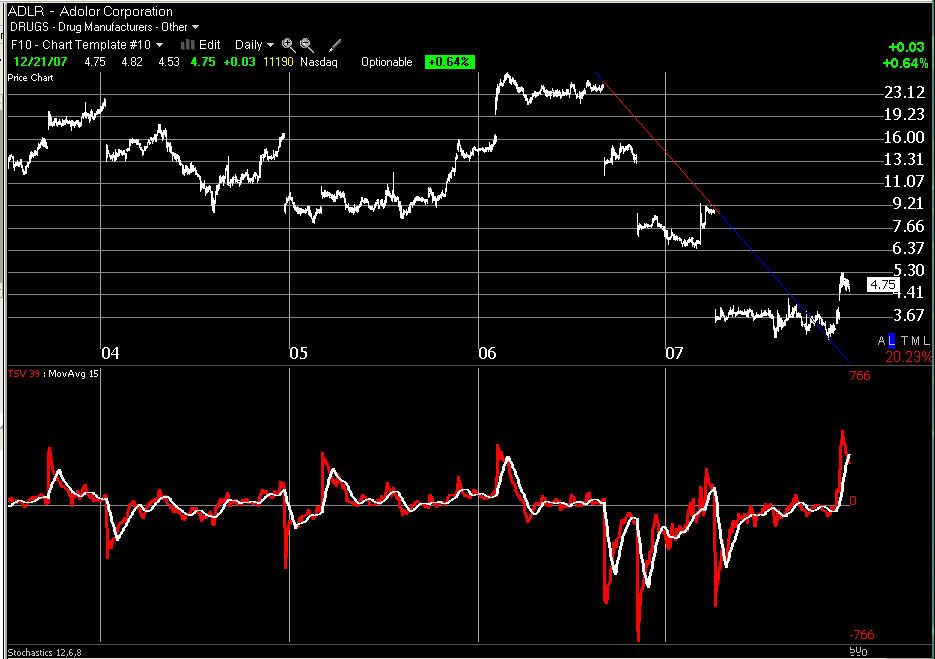
Here's a fairly interesting example of a 200ma breakout. Granted, this is already well into the breakout but it looks like there's plenty ahead. Pharma stocks are looking interesting lately so this might be a good one to put into a watchlist and be ready for the pull backs.
That's where the set up shown in the beginning of this thread might serve well. You can "bottom fish" the pullbacks in a newly uptrending stock.
|
|
Registered User
Joined: 10/7/2004
Posts: 2,181
|
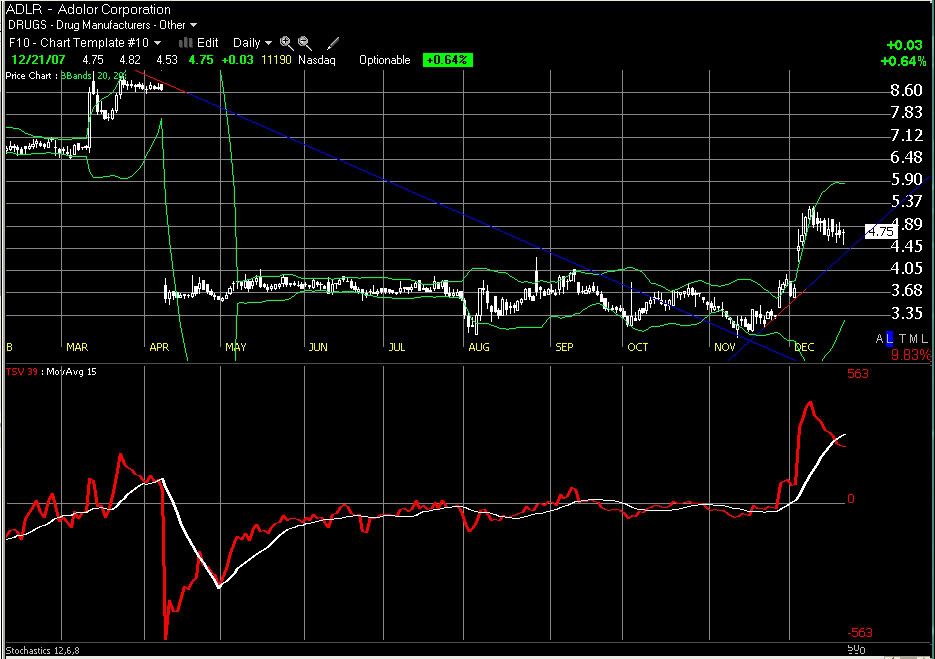
Here's more of a closeup of ADLR. Note the supporting trendline; if it bounces off of that strongly, it might be time for the next leg up. Otherwise, I'm just guessing the LBB20 will be the next support level. At that point, I'd love to see support from the LR30 before re-entering.
Again, this is not what's right for everyone, this is all just in the context of the "tobydad profile"; just discussing the way that I use this set up.
|
|

Registered User
Joined: 3/21/2006
Posts: 4,308
|
Thank you Tobydad, for including me in your list of fellow bottom feeding collaborators. Ponchomike, and anyone else looking to do some bottom feeding. Both Tobydads and some of my set-ups are really looking to uncover the same type of action, just using different indicators that each tobydad and I are most comfortable with.
Do what we did. Find successfull bottoms that spond a good rally and see what the indicators looked like right before the price movement. Study a lot of them find common threads and design indicators to help you find these common threads. Our set-ups are just half of the equation. How you mangage the trade is equally if not more important to your success.
Hard study and designing your own set-ups in the long run will lead you to greater success, because it will be your personality driving the system, and that should be the ultimate goal of every trader. Since a very low percentage of those that choose to trade the markets become cuccessfull at it, the one thing that they all have in common is that they designed and managed their own system of trading. Do not be happy eating the fish that Diceman, Tobydad, Booker, Davidjohnhall and many others catch for you. Learn to fish and you will never go hungary (who said that) 
Any way good luck to us all in the new year, I cannot wait to see what new secrets we here on this great forum are able to discover together as a team...
Apsll...
|
|
Registered User
Joined: 8/8/2007
Posts: 42
|
Apsll,
Thanks for the advice.
I'm somewhat of a beginner and I'm just beginning to put together my strategy. I've been more or less position trading for about six or seven years, mostly with companies I know and understand. One of the things I plan to do is look at some of the PCFs I find posted and analyze them to see exactly what they're looking for. I'm probably going to sign up for the Technitrader course tomorrow to complement my Worden subscription.
I've put together a system that has worked well over the last few years for catching the bottom of selloffs in the NASDAQ and S&P500. I've done well with picking entries, my problem is picking my exits.
One of the things I found when I was searching some of the old discussions threads was reference to a website that provided detailed information on the various candlestick patterns. I've tried to find it again with no success. Does anybody know of a good website that explains candlestick patterns?
Thanks,
Mike
|
|
Registered User
Joined: 1/28/2005
Posts: 6,049
|
"Does anybody know of a good website that explains candlestick patterns?"
---------------------------------------------------------------------------------------------
Candle stick forum is one. I believe they even have PCF's for telechart.
Thanks
diceman
|
|
Registered User
Joined: 2/8/2006
Posts: 7
|
Td, I like how FLML is forming my J-hook pattern.I really dont understand your charts on it with bolli bands and candlesticks, but i will try to analyze them when I have time . I think it should go to a $17.50 close soon and intra-day could hit $20. I remember a stock about a yr. and a half ago with a similar pattern although its prior downtrend wasn't as abrubt as FLML. It was HRT and went from $9 to $32 or so. If you trade stocks, FLML looks like one to trade as well.
|
|
Registered User
Joined: 10/7/2004
Posts: 2,181
|
FLML really looks like it is getting ready to go higher.
|
|
Registered User
Joined: 2/19/2008
Posts: 193
|
I'm quite currious about all this and am watching carefully. Lisa I found this thead on the tobydad profile helpful. Let me know if you find anything else.
Jean
|
|
Registered User
Joined: 4/14/2009
Posts: 20
|
Hello (sailnadream) Jean,
I have been looking at all the post for the Tobydad profile that I can find and these two are something to check out, in post 30865 on Monday, April 7, 2008 and in post 30752 on Wednesday, April 02, 2008. With the bits and pieces I have found I sort of understand what he is looking at but with the search only letting me go back so far it is not like you can get the whole history, and if you query tobydad you are limited to the certain amount of post also.
L
|
|
Registered User
Joined: 10/7/2004
Posts: 2,181
|
Thank you for reviewing first. Let me know what questions you have and i will do my best.
|
|
Registered User
Joined: 2/19/2008
Posts: 193
|
Tobydad,
Could you explain what you mean by LR 30 must be watched carefully?
Do you use LR 10 and if so how?
Thanks
Jean
|
|
Registered User
Joined: 4/14/2009
Posts: 20
|
Hi Tobydad,
Thanks for the response. I do for the most part understand what you are seeing, the biggest issue for me is narrowing down the list of stocks to watch. I have all the scans you have posted and what I end up with is a huge list.
Do you go through all the scans daily or weekly? I am trying to find something that works for my schedule, I work in the ER and my shift is 24 on 24 off, I do have the ability to watch the stocks on my list at work, but need to be able to narrow down the list to 20 or so like yours. I can only change and/or scan for stocks on my day off. Also, after going through all the stocks and coming up with a list, the crushing part was only one matched what you had posted. That part I understand may take time to get right.
Thanks for your time Tobydad,
Lisa
|
|
Registered User
Joined: 8/19/2009
Posts: 170
|
so i saw it a few times and was wondering whats the tobydad profile?
|
|
Registered User
Joined: 1/28/2005
Posts: 6,049
|
intothetrade
See my last post here:
In the link look at my May 26 4:41:43PM post.
Thanks
diceman
|
|
Registered User
Joined: 2/19/2008
Posts: 193
|
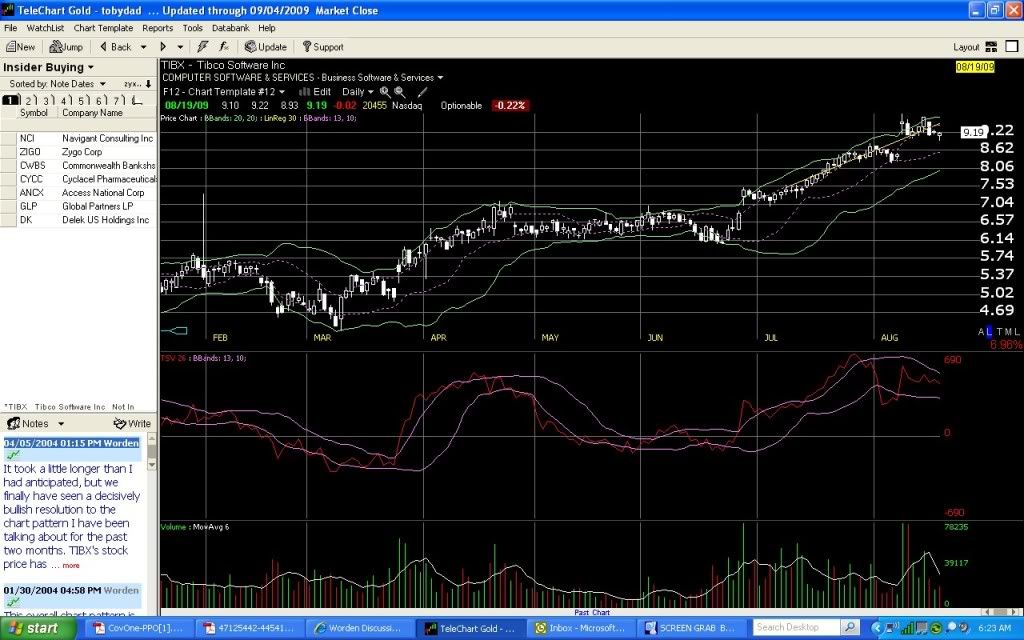
Tobydad, could you help with determining entry points? I've never used bb bands or LR lines and would like to understand how to use them. Looking at DPTR I see that it is just over LR30. Would that indicate an entry point or are you looking for LR30 to support the lower edge of the candal? In another instance with TIBX, on 08/19 it was touching LR30, I enterred into it but it did not follow through, it stopped out, now it's below LR 30. Yesterday we had an engulfing candal. Could you give me an idea of how you would read this in terms of your profile. I imagine that if I had waited for TSV to be moving up it would have been a better entry.
Thanks
Jean
|
|
Registered User
Joined: 10/7/2004
Posts: 2,181
|
TIBX touching LR30 on 8/19? Could you recheck your chart, please? I don't understand. It's not touching on mine.
|
|
 Platinum Customer Platinum Customer
Joined: 4/17/2006
Posts: 271
|
Hi, TobyDad! Thanks for yet another explanation of your excellent strategy!
|
|
Registered User
Joined: 2/19/2008
Posts: 193
|
Tobydad, yes the tail is piercing the line.
|
|
Registered User
Joined: 10/7/2004
Posts: 2,181
|
Sharkattack! Where haaaa-vvvve you been? I was just thinking about you the other day when reviewing some of the folks we haven't seen here in a while. Good to hear from you. Are you back for a while?
Sailnadream, I do not get it; are you sure you are using LR30 on price. 0 width setting? 0 extension?
On my chart, LR30 is above the candle and not touching at all on TIBX on 8/19. I am completely lost as to what you are talking about but happy to help if we can clear up our disconnect.
|
|
Registered User
Joined: 2/19/2008
Posts: 193
|
Tobydad,
That's what I have and I've removed and added it several times with the same effect. I wish I could figure out how to copy a chart so you could see it. Think I'll ask a trainer what's up with the line. Meanwhile I'm bleary eyed from studing LR lines but I'm understanding how to use them better. When you talk about watching the LR closely what are you looking for in entries and exits?
Thanks so much and please keep sharing.
Hiromj,
Thanks for the support. I've read a lot of the history. Too bad that one must wade through all the dirty waters to get some information. I respect yours and others patience.
Oh joy a new nickname, I love it!
Sail,
aka, Jean, Jeannie, Jeannette, Lisa, Ji, and Beaner
|
|
Registered User
Joined: 10/7/2004
Posts: 2,181
|
|
|
Registered User
Joined: 10/7/2004
Posts: 2,181
|
Jean;
Tell me how this is different from what you're seeing.
|
|
Registered User
Joined: 1/14/2006
Posts: 8
|
Hi Jean,
The LR30 changes day by day. If you want to see where it actually was on 8/'19, you need to back the chart up until 8/19 is the right-most date on the chart. You will see that it was not touching the price bar on that date.
If you're looking at the chart on 9/3 (date of your post), the LR30 appears to be under the price because it has moved over the last several days.
ptb (another nubie)
|
|
Registered User
Joined: 2/19/2008
Posts: 193
|
TD, Thank you, cleared it up! I was looking at the chart from todays date. When I bracketed back, my chart looks the same as yours.
So--back to the question--how do you 'watch the LR carefully 'and what do you look for in entries and exits?
|
|
Registered User
Joined: 3/21/2006
Posts: 4,308
|
Sail, aka Jean...
You could also try sorting the 30 day linear regression by percent of slope...
|
|
Registered User
Joined: 1/12/2009
Posts: 235
|
Tobydad, would you mind posting the link to your trading system and how it is laid out? I can't seem to locate it. Thanks.
|
|
Registered User
Joined: 2/19/2008
Posts: 193
|
APSII,
Thank you for the tip. I'm playing with the percent of slope sort. Don't quite know what to do with it but it is making for some very interesting candidates.
TD,
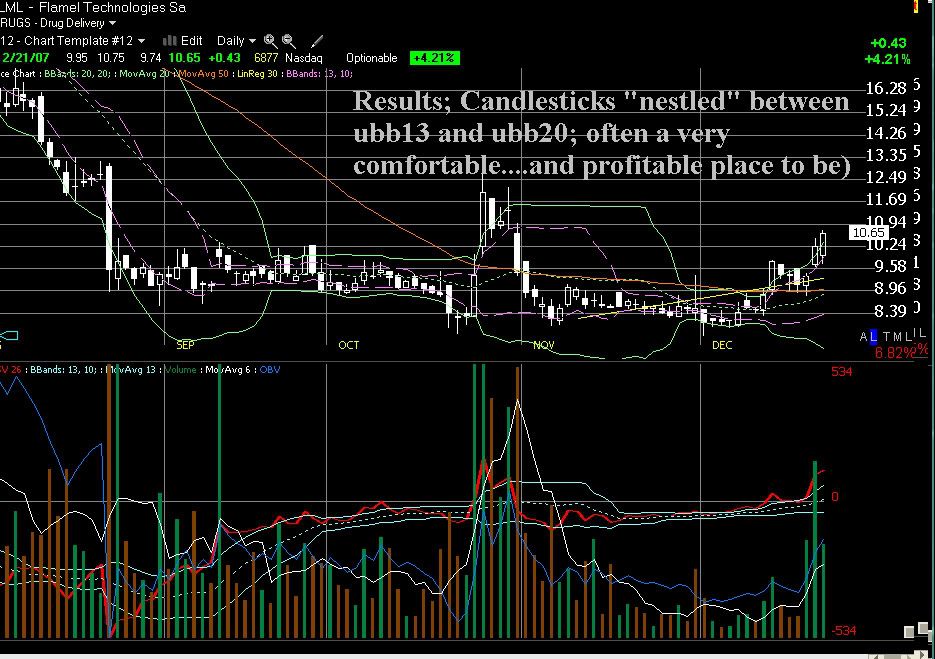
On your December 07 chart of FLML, I notice that there were about 6 ot 7 days where price was supported by LBB20 and LR30. How did you decide on Dec 7 for the entry day as opposed to the others? I'm finding that these chart patterns seem to pop quite early, often as price rises from below the LR30 and just touches it.
|
|
Registered User
Joined: 3/21/2006
Posts: 4,308
|
You are welcome Jean.
You find the negative slopes and then sort that list by a 6 day linear regresion line on TSV. On the LR for the TSV you want a possitive slope. The trick is to use a tight stop baecause you will get some false buy signals. When you do get a runner than sell after 7% or use a trailing stop. The Tobydad system can be profitable if played correctly and one must pay close attention. The linear regrsion on the TSV was my adaptation. It helped me but you must work with the system and make it work for you. Tobydad was great for designing the Template for successfull bottom feeding.
|
|
Registered User
Joined: 2/19/2008
Posts: 193
|
Hi Apsii,
I know I'm gettting some of this because already my profits have improved. But I am just starting to understand. It's hard to pick up all the threads. Could you explain the beginning of the process "you find the negative slopes". I'm not sure how or what I'm looking for.
Thanks for your guidance.
Jean
|
|
Registered User
Joined: 3/21/2006
Posts: 4,308
|
How are you Jean. This will be all that I can do for you as I will not be posting any longer on this forum.
You can do a custom date sort for stocks that are declining. You then put those stocks in a watchlist and sort for the 30 day linear regression for percent slope. looking for values less than zero. now put thes stocks in a watchlist (you will notice that the watchlist will start to get smaller and smaller with each new sort) Now you plot a five or six day linear regresion line on TSV 14 (exponential) and sort that linear regresion line for a positive slop. You should now have a managable list where you can look at the stocks and see wich charts are sporting a nice open candle on top of the 30 day linear regression line. You are in esscence looking for a bounce.
This is not exactly how Tobydad designed his great system, but it is what I did with it for my own use.
Good luck Jean.
Tobydad, it has been for the most part a fun ride. especially in the begining... Take care old friend......
|
|
Registered User
Joined: 10/7/2004
Posts: 2,181
|
TraderM30 and Jean,
I apologize that I have not yet answered your questions; I have been very busy.
TraderM30, I think the archives have been limited; don't know when but I'll try to write a new review.
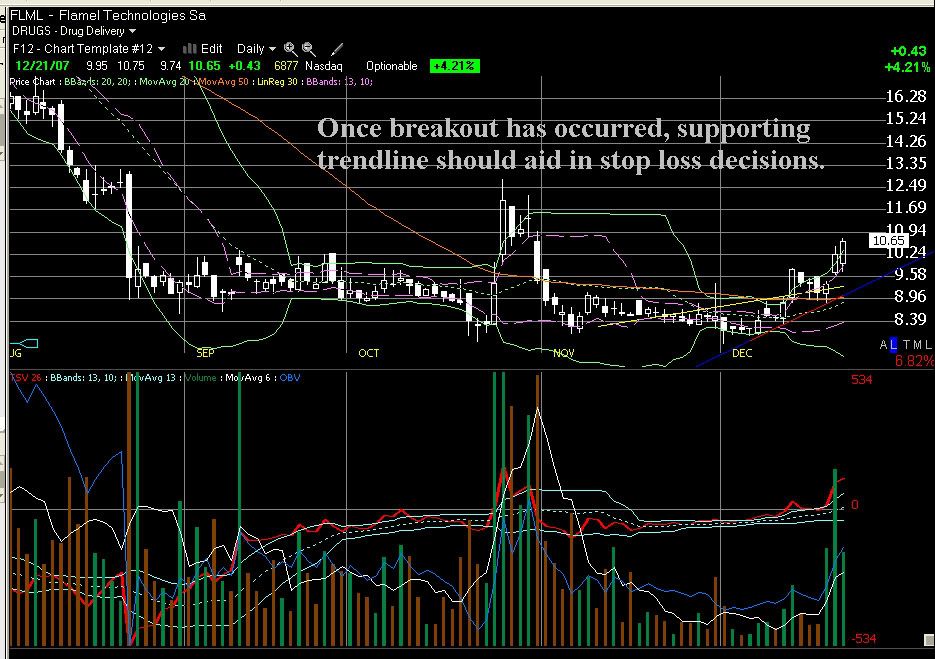
Jean, I think the selection would have, normally, been triggered by a bump in volume, a bullish candle sitting directly on the LR30 and minimal overhead resistance from the ubb20.
|
|
Registered User
Joined: 10/7/2004
Posts: 2,181
|
Apsll;
See you 'round. Thanks for the great discussions; all the best on your ventures. And remember, God loves you.
|
|
Registered User
Joined: 2/19/2008
Posts: 193
|
Apsii,
I am sorry to hear that you are leaving. Thank you for all your help. I enjoyed your teachings and your wit.
May you enjoy fair winds.
Sail
|
|
Registered User
Joined: 1/30/2009
Posts: 267
|
QUOTE (sailnadream) Apsii,
I am sorry to hear that you are leaving. Thank you for all your help. I enjoyed your teachings and your wit.
May you enjoy fair winds.
Sail
He is only leaving temporarily. He will be back soon enough.
I have taken notice of your ability to raise your post-count much faster than the rest of us (:-)).
|
|
Registered User
Joined: 1/30/2009
Posts: 267
|
QUOTE (hiromj) QUOTE (sailnadream) Apsii,
I am sorry to hear that you are leaving. Thank you for all your help. I enjoyed your teachings and your wit.
May you enjoy fair winds.
Sail
He is only leaving temporarily. He will be back soon enough.
I have taken notice of your ability to raise your post-count much faster than the rest of us (  ).
Sorry, just noticed the opening line of Apsll's last post. Hmmm, I don't know what is up with that but, I must admit, I have not read all the posts in all the threads.
|
|
|
Guest-1 |