Registered User
Joined: 12/21/2004
Posts: 902
|
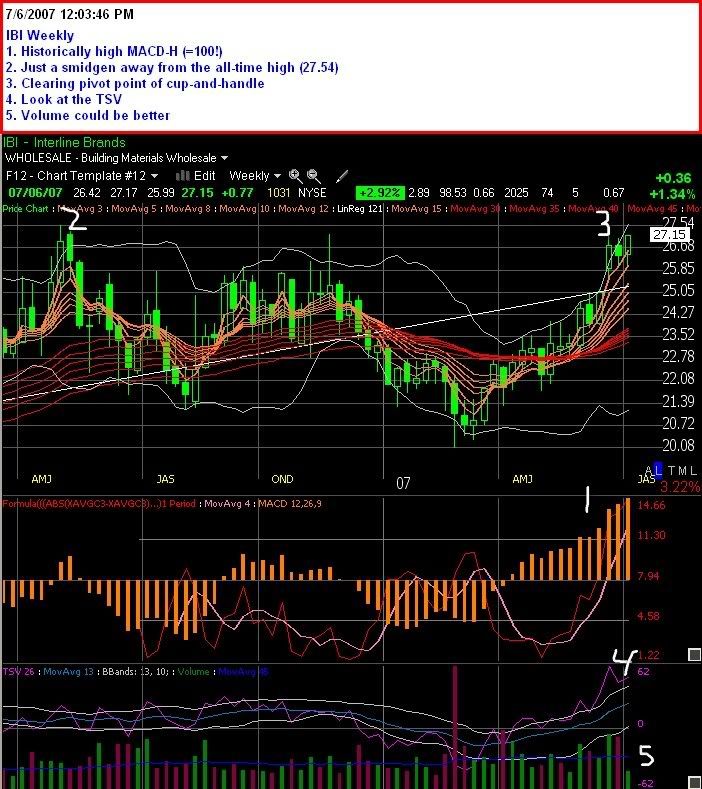
A chart that has caught my eye this morning is IBI. It is in the Building Materials industry, which is a fairly strong industry right now - and has interesting charts both daily and weekly.
On the daily chart, it looks a bit over-extended (and the MACD-H isn't even at 100 yet, as the MACD-H was a bit higher back in March - but it still is meeting Elder's criteria of "multi-month" price and MACD-H highs). What I like about the daily chart are the volume indicators - First, the 3 Worden volume indicators, MS, TSV, and BOP are all looking good. MS is well above it's 26MA, and TSV and BOP are all high. Then, looking at what I call the "Tobydad Profile", TSV26 has been generally above 0 since March, has generally been above its 13ma, and is also at the higher end, (but not running above) it's 13bb (which is also rising). Another element is OBV and lr255 - in IBI's case the OBV is way high above the lr255, and climbing. And price bars are getting very nice support from the lr30. Tobydad hates a dangling price bar and these guys aren't dangling. Also still within the higher 20bb line. All very sttractive.
But looking at the weekly chart is what really gets my juices flowing. A lot of times the daily chart is a forest and trees thing, and you really don't see the big picture until you step back and look at weekly and monthly charts - and this is definitely the case with IBI.
The most obvious feature is a triple top. This week's high is 1 penny below a peak in last November and spitting distance from it's all time high last May. Some will look at this and say "Resistance" -
I look at this and say "Third time's the charm".
Look at the MACD-H (natch - would you expect anything else from me?) Compare the robust strength of the MACD-H now (MACD-H=100), compared to the paltry puny MACD-Hs of the previous highs. They had no bullish momentum going either time, so of course they met resistance. The way I see MACD-H, that resistance shouldn't be a problem now.
Also, look at volume - it's not *awesome* right now, but is looking pretty good, and, compared to those last 2 peaks, it is definitely much improved.
So this is a chart that I definitely want to go in on. Either put in on the MACDH100 watchlist and wait for HNC/Diceman on the daily chart, and/or (what I probably will do) put on my daily intraday watch list in anticipation of a high volume breakout as it takes out those highs and enter as that is happening.
This weekly chart also affords an opportunity to point out a good example of a MACD-H divergence.
Compare the last 2 down cycle MACD-H islands (May-Aug 06 and Dec 06- Apr 07) with the lowest price points during that time period. In the first, MACD-H and price both hit their lows during the week ending 08/07/06. In the next down cycle however, the low price point went lower, however, the MACD-H didn't go anywhere near as low - a MACD-H divergence. First off, this is a dmonstration of the bearish side of Elder's MACD-H observation - in this case, a multi-month price and MACD-H low (08/07/06) indicated that the price low would be retested (and it was), but more importantly, even though the price dropped lower than the first cycle, the indication was that the bears were no longer nearly as powerful as before. And within 4-5 weeks MACD-H was back above 0, with increasing power, and shows a price rally gaining stronger momentum.
Not every MACD-H divergence pans out, but when it does happen, it can be a sign that a stock's fortunes are changing (and I don't see where you could have gotten that divergence information from just the plain MACD until several weeks later) As you're looking at stocks, especially weekly charts with less noise (and where Elder says that divergences are more meaningful). Keep an eye out for divergences, both historically, to see if that particular stock responds to divergences, and currently for possible setups. This would have been a nice stock to get into back around Mar 21 or so.
|
|
Registered User
Joined: 9/22/2005
Posts: 849
|
hohandy
What values do you use for your MACD short, long, and period. These will be helpful in following your examples.
|
|
Registered User
Joined: 12/21/2004
Posts: 902
|
I always keep 12,26,9 settings. Keep the same chart up, just change the number of days using the number keys.
|
|
Registered User
Joined: 9/21/2005
Posts: 566
|
HH, I noticed CMED. Curious what your take on it is from a MACDH perspective. Its a Chinese stock so if their market corrects in a big way that is a potential risk. I think the gap is impressive though on good volume. Could be setting up for an HNC/Diceman.
|
|
Registered User
Joined: 12/21/2004
Posts: 902
|
Hiya JC - tell you what - why don't you tell me what you see on CMED, MACD-H-wise, and then I'll tell you whether I agree or if I think you've missed something that I would consider meaningful. that ok?
I'll be around until about 4:15 or so and then again later on tonight.
|
|
Registered User
Joined: 9/21/2005
Posts: 566
|
The master becomes the student?
OK, I wil give you my general take including MACDH. I see a stock that is likely to go higher. Highest MACDH in a year on recent breakout and good volume as well. Dont see excessive recent selling (meaning none of the big boys are rushing for the exits). Stock has not retested the low of the prior gap - a good sign. I dont really use the Worden indicators but would assume those are bullish as well. Industry support seems solid. Have not checked the news so cant comment as to what caused the breakout but if I were going to trade it, I would want to know. Seems like a good stock to enter a position in but would probably enter in gradually as I wouldnt be surprised if it went sideways for a bit. On the HNC/Diceman, it could stand to consolidate a bit more.
By the way, I saw CCC a while back and watched it closely. It would be more impressive to say I got on board and profited but I can't make that claim. I can claim to have seen it and noted to myself that it was likely to go higher. I remember talking with you about chemical stocks and how many were showing strength. Not sure this one would have come up on your MACDH screen, or would it have?
|
|
Registered User
Joined: 9/21/2005
Posts: 566
|
had some free time so checked the news behind the jump in price in June:
China Medical expects a sharp rise in revenue during its 2007 fiscal year. Shares rose $2.85, or 10.5 percent, to $30.10 in premarket trading.
|
|
Registered User
Joined: 12/21/2004
Posts: 902
|
Hey JC - here's my take on CMED MACD-H -wise. There's other things that help tell the story besides the recent high MACD-H (which in itself is a good thing). Compare this up cycle to the last down one. Bulls much stronger than bears. Compare the last down cycle to the previous up cycle - up cycle island much bigger/higher/longer lasting than the down one - bulls stronger than bears. Compare the last down cycle to the one previous to it - the earlier one was much bigger/deeper, etc. - the bears were much stronger then than they were in May.
Also look how much quickly in this upcycle the MACD-H rose to high territory - MACD-H was already at a multi-month high before the gap-up.
So it's no surprise that when good news came along, there was nothing to stop the bulls from driving the price higher. I see the current horizontal price consolidation (on declining volume) as an extremely strong bullish sign - it's showing that the bears currently have no power to drive the price down. The declining MACD-H is indicating that there hasn't been a whole lot of follow-through since the gap-up, but since there hasn't been any bearish strength I don't see that as necessarily a terrible thing. I doubt that the MACD-H will go below zero much, if at all - and it should only be a matter of time before the bulls have a reason to buy again.
But look at the weekly chart - very strong MACD-H - record territory - following a very weak down cycle. Since the weekly up cycle is only in its 4th bar, I'd say that shows that there's still quite a ways to go.
One of the best strategies is to find a strong longer term chart with a corresponding weaker daily chart indicating a good entry point. From the MACD-H in both the weekly and daily chart on this one, I'd say that CMED might fit that strategy.
|
|
Registered User
Joined: 9/21/2005
Posts: 566
|
HH, I will have to read you commentary and toggle back and forth between it and telechart. Will have to wait till using my home pc. By the way, if you are inclined, I am sure the MACDH club would appreciate a pic or two from you as you trade it - including entry, exit and trade rationale?
|
|
Registered User
Joined: 12/21/2004
Posts: 902
|
JC - I don't know if my trading will teach anybody anything, as I don't have any real disciplined system for entry and exits such that annotating my actual trades would really be of value to anyone. I generally look for trending stocks with high MACD-Hs (indicating a strong trend) *or* repeated daily showings on the IBD "Stocks on the Move" list.
As I do my nightly scans and analysis I have posted about several interesting stocks (usually from the MACD-H perspective) that have caught my eye and why - and many of them have played out pretty well - HOS, MTZ, CY, MTOX, KMBG, CLF, SPAR, RCCC (which has had a bad couple of days lately and is not the well-behaved stock that I thought it was when I posted - but which may be providing a nice entry point at the 13ema).
Right now my eye is also on JSDA - which just broke a long down-turn today with a strong breakout day, and re-appeared on the IBD list for the first time in a couple of months. Since this stock was such a favorite in the 1st quarter, I'm hoping that it will attract buyers now that it is lifting off of its bottom. From a MACD-H perspective, notice how the strength of the bears has virtually dissipated - 3 down cycles, each getting progressively shallower. A couple more days like today could easily see a new MACD-H multi-month high indicated good upward strength (although it would have to rise a bit more in price to get a multi-month price high).
I like your suggestion of posting pics to explain my analyses. I have no idea how to do it, so I'll look into it. I know it helps a lot when Tommy posts the pics of the charts and indicators that he is working on. If it will help some people grasp the MACD-H concept a better so they can actually use it profitably, then it will be worth it.
|
|
Registered User
Joined: 12/21/2004
Posts: 902
|
ok - lets try this out with a picture of JSDA

|
|
Registered User
Joined: 1/28/2005
Posts: 6,049
|
hohandy
Your JSDA chart made me think of a scan:
((XAVGC12 - XAVGC26) > (XAVG(XAVGC9,12) - XAVG(XAVGC26,9)) AND (XAVGC12.1 - XAVGC26.1) < (XAVG(XAVGC9.1,12) - XAVG(XAVGC26.1,9))) AND ((XAVGC12.10 - XAVGC26.10) - (XAVG(XAVGC9.10,12) - XAVG(XAVGC26.10,9))) < 0 AND ((XAVGC12.20 - XAVGC26.20) - (XAVG(XAVGC9.20,12) - XAVG(XAVGC26.20,9))) < ((XAVGC12.10 - XAVGC26.10) - (XAVG(XAVGC9.10,12) - XAVG(XAVGC26.10,9)))
This states that MACD-H 12,26,9 crossed zero today. Was below zero 10 bars ago and 20 bars ago was lower than 10 bars ago.
(just a guess at the lengths)
There were 65 stocks "true" today. It brings up some interesting charts.
Let me know if you find this useful.
Thanks
diceman
|
|
Registered User
Joined: 12/21/2004
Posts: 902
|
Thanks Diceman - this looks like it will be interesting to play around with
|
|
 Gold Customer Gold Customer
Joined: 11/11/2006
Posts: 359
|
Good Pick, Hohandy, on JSDA. Up 10% today already
Mammon
|
|

Registered User
Joined: 3/21/2006
Posts: 4,308
|
Hohandy, this is a good pick and a good chart. I was watching this one last year as it was building that ascending channel from August to December but never acted on it.
I read at that time that they were in league with National Beverage corp (FIZZ). I would have done well to buy both back then..
If you would not mind sharing (how did you insert the notes on top of the chart). I would not mind doing that with my charts..
|
|
Registered User
Joined: 12/21/2004
Posts: 902
|
Thanks Mammon - actually, Jcfla7 brought this to my attention last week and we discussed it a bit on June 26-27 in the "Hohandy" thread - so he gets the credit for the pick.
One thing I mentioned then that I didn't mention when I did this chart commentary last night was the glaringly obvious bullish MACD-H divergence (duh!).
Diceman, I assume it would be fairly easy to tweak your formula to include some sort of price indicator to pick up divergences?
|
|
Registered User
Joined: 12/21/2004
Posts: 902
|
Hey Tommy - I downloaded a piece of freeware/shareware called "FastStone Capture" (do a Google). Very easy to use, and it includes a feature that allows you to put in a "Caption" - which I think works very well for these sort of Notes. Supposedly it does have a text/draw feature to add annotations to the chart itself, but I haven't gotten that far yet. Theoretically I'd like to number each "bullet" on the notes and then place that number on the area of the chart that I'm talking about for reference.
|
|
Registered User
Joined: 3/21/2006
Posts: 4,308
|
Hohandy, I downloaded the program for the 30 day trial. (did you purchase it or are you trying it out first)?
Thanks for stearing me to this, I will check it out...
|
|
Registered User
Joined: 12/21/2004
Posts: 902
|
I've had it for several months and I've never been asked to pay. I have version 5.2 which is Freeware (even says in the "About" section of the menu "Free to Home Users") - it looks like the latest version (5.6) is Shareware.
|
|
Registered User
Joined: 12/21/2004
Posts: 902
|
ok - remember IBI - the original subject of this thread? On the move today. New 52 week high, closing in on the all-time high. High. Retested the MACD-H100 on the daily chart, nice high MACD-H and TSV on the weekly chart. Could have stronger volume though.
Since I've last updated, price is now up to 27.30
|
|
Registered User
Joined: 1/28/2005
Posts: 6,049
|
"Diceman, I assume it would be fairly easy to tweak your formula to include some sort of price indicator to pick up divergences?"
-----------------------------------------------------------------------------------
Yes. (I had assumed you wanted to see strong stocks also)
Something like:
ANDC<C20
(close is below 20 bars ago)
or
ANDC<(C20*.98)
(close is more than 2% lower than 20 bars ago
these could be adjusted to lengths and levels
required)
Could be added.
-----------------------------------------------------------------
Perhaps the best way would be to add a 20 period
(or whatever length you would consider useful)
liner regression line to the true candidates and do a
percent slope sort.
Then you will have them arranged by both strength
and weakness.
Thanks
diceman
|
|
Registered User
Joined: 12/21/2004
Posts: 902
|
Thanks Dice - I would use them separately - one to screen for the getting stronger stocks and one to screen for the divergences.
|
|
Registered User
Joined: 9/21/2005
Posts: 566
|
HH, great job with your charts and analysis. I'm sure all the MACDH'ers appreciate your helpfulness. I know I do.
|
|
Registered User
Joined: 9/21/2005
Posts: 566
|
By the way I did an experiment a few weeks back with a blind list of top bar 1% stocks and top bar overall stocks. I will post the names in a week or so after more time has passed but so prelim results do not look all that impressive, which lends support to your comments on that approach.
|
|
Registered User
Joined: 12/21/2004
Posts: 902
|
JC - I don't know how proficient you are at Excel, but something I used to do, way back in those crazy days before I discovered Telechart, was to take the Top 100 and do both a daily and/or a weekly change in alpha value analysis, and work off of a list of maybe the top 10 stocks that had made the best % gains in alpha values - because what you really want off of that list are those that are moving, not those that have achieved a rank and are just sitting there or just starting to drop.
Since I've gotten Telechart, and can do things with indicators, there's been no need for me to do that drill and I stopped - but I remember that I had some pretty good results with that methodology as a newbie.
With all the tools at your disposal, there should be no reason to do anything blind.
|
|
Registered User
Joined: 9/21/2005
Posts: 566
|
Thats interesting. Never thought of trying that. Good idea.
As far as excel goes, I consider myself pretty capable in it. Use it for work and use it every night to analyze a number of approaches that I track. The beauty of getting the stocks into excel is it can do all the calculations that telechart can't. Also I have historical performance and more importantly indicator readings on many lists of stocks going back to late 2005. A major pain in the rear to do the data entry but once you do, the benefits become apparent. If only telechart could fully sync with excel, it would be fantastic.
By the way, there was a thread that I posted on with both Tobydad and Diceman a while back on the merits of 'spread' trading between your long and shorts. It kind of ties into my 'surfer' theory about always having some stocks in play because the market can do anything in the short-term. Lately some approaches along this path have been producing solid results. Don't know if its only because current market conditions are favorable or if it has some longer-term potential, but I like the surfer concept. You sit on the beach and relax in your lounge chair and your surfers wait for the waves. You always have some riding in and some riding out. Gotta love these mellow, righteous analogies.  
|
|
Registered User
Joined: 12/21/2004
Posts: 902
|
JC - when you talk about Telechart being in full sync with Excel - are you talking about the limited information available for exporting to Excel - or are you referring to some other Telechart/Excel issue?
|
|
Registered User
Joined: 9/21/2005
Posts: 566
|
the former, not the latter. The day when telechart will be able to fully export and import to excel will be a great leap forward in the life of the program.
|
|
Registered User
Joined: 9/21/2005
Posts: 566
|
HH, take a look at MNI. Similar to JDSA. Take a look at MACDH. Would you have pulled the trigger on MNI?

|
|
Registered User
Joined: 12/21/2004
Posts: 902
|
JC - it's actually almost the opposite of JSDA. The latest down MACD-H cycle in JSDA barely gets below the 0 (indicating the bears are done) - in MNI it is the opposite - the latest down cycle is bigger than what came before - the bears are getting stronger, not weaker. In fact, the minimum point (june 26) is a MACDH-0 - in other words - multi-month price low and multi-month MACD-H low - meaning that low price should be retested according to Elder's dictum.
The bottom on this guy hasn't been reached yet whereas in JSDA it was evident from the MACD-H that the bears were done and the bottom had been reached.
|
|
|
Guest-1 |